Climate change, declining consumption and increasing operational costs are all a part of the reality today’s water and wastewater utilities are facing. So how are the largest U.S. cities managing these factors and building rate structures for long-term resilience?
According to respondents in the 2018-2019 50 Largest Cities Water & Wastewater Rate Survey, utilities are modifying how they charge for services to address revenue stability and affordability concerns. Following extreme weather events in 2018 such as hurricanes Florence and Michael, the need is now more urgent for rate-making mechanisms that enable financial, operational and organizational resilience.
The analysis team calculated the typical bill for various residential, commercial and industrial user profiles based on the inputs of representatives from the 50 largest cities in the United States, as determined by population, that provide water and sewer services.
Market Dynamics Impacting the Cost of Water Services
Since the first 50 Largest Cities Water & Wastewater Rate Survey in 2001, increases in the typical residential water and sewer bill continue to outpace the rate of inflation. Higher water and sewer bills are a reflection of several dynamics:
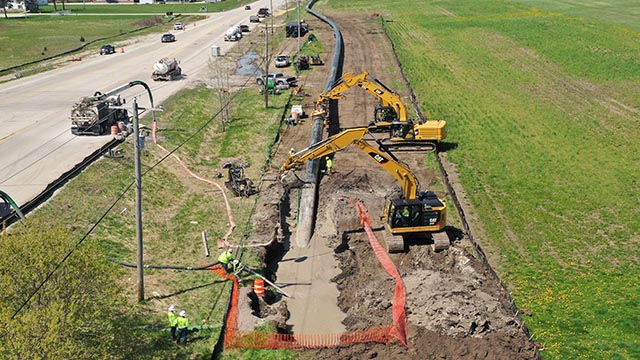
- Many utilities have had to develop charges specifically for capital projects or ongoing replacement and rehabilitation (R&R) needs due to aging infrastructure concerns.
- Operational costs associated with source of supply, treatment and disposal, labor, pension obligations, and contract services have increased at a faster pace than the rate of inflation.
- With tightening financing requirements for long-term debt, many utilities have had to cash finance projects through cash reserves and rate increases.
- Regulatory requirements have driven the need for significant capital programs for developing new water supply sources or to comply with clean water requirements.
Rising rates are a direct result of cities and utilities grappling with the effects of aging infrastructure, rising operational costs, evolving capital funding mechanisms and regulatory requirements.
Consumers continue to see household water and sewer bills increase. But, when compared to other related household costs, it is still a good value.
Rate Structure Trends
Residential
Comparing 2001 and 2018 survey data, the number of survey participants with a uniform rate for residential customers remains essentially the same at just over one-third of participants. However, since 2001, there has been a significant decline in the popularity of the declining rate structure. The use of the inclining tier design climbed from 46 percent to 60 percent of participants in 2018.

Non-Residential
Similar to residential customers, survey participants are moving away from the declining block structure for non-residential customers. While the percentage of uniform rate has decreased from 2001 to 2018, the inclining block structure has gained in popularity.
For more information, get the 2019 50 Largest Cities Water & Wastewater Rate Survey report below.
2018 Stormwater Utility Report
Black & Veatch Management Consulting, LLC is a wholly-owned subsidiary of Black & Veatch and provides integrated strategy, financial planning solutions, business operations, and technology solutions for water, wastewater, stormwater, power, oil and gas, and renewable energy utility sectors.


